

May 6, 2024

August 1, 2017
The 'Canada Model' For Pension Fund Management: Past, Present, And Future
“The new institutions we have created to administer and invest pension monies must have adequate management and be rendered legitimate. They have to be autonomous institutions, be accountable to their constituencies, and free from any suspicion of conflict of interest.
From “The Unseen Revolution”Peter Drucker, 1976
“Ontario taxpayers could potentially benefit by at least $1.2 billion over a period of 10 years if all public sector pension assets were invested competitively through financial markets. Plan sponsors should ensure formal processes are in place for holding pension fund governors accountable for results. This includes governor decisions whether to outsource or insource the investment function, and ensuring that internal investment managers are competitively compensated.”
From “In Whose Interest?”Task Force on the Investment of Public Sector Pension FundsReport to the Treasurer of the Province of Ontario, 1987
The Past
Twenty years after the publication of “The Unseen Revolution”, Peter Drucker would write this about his 1976 book on pension politics and management: “No book of mine was ever more on target when it was published, and no book of mine has been more totally ignored”. Fortunately, I did read it at the time and took its key messages (see above) to heart, as evidenced in my own book “Pension Funds and the Bottom Line” (1985). Two years later, the creation of Ontario’s Task Force on the Investment of Public Sector Pension Funds by Treasurer Robert Nixon opened a window to actually put Drucker’s messages into practice (see the [somewhat restated] quote from the Task Force Report above).
In short, based on Drucker’s principles, the Report recommended that pension funds should have a clear mission, have a strong independent governance function, and be able to attract and retain the requisite talent to be successful.
The most tangible outcome of the Task Force’s Report was the creation of the Ontario Teachers’ Pension Plan (OTPP). The prior plan (Teachers’ Superannuation Fund) had been a government bureaucracy for decades, with all of its assets ‘invested’ in non-marketable Ontario bonds. Treasurer Nixon and Margaret Wilson, President of the Ontario Teachers’ Federation (OTF), jointly agreed to transform the teachers’ pension plan bureaucracy into the Drucker model recommended by the Task Force.
Legislation was drafted to create OTPP as an arms-length entity jointly-owned by its Partners: the Ontario Government and the OTF. As recommended in the Report, a Board selection protocol was agreed on to ensure the organization would benefit from strong, knowledgeable governance. The Board was given a clear mandate to hire a top-notch executive team at market-competitive compensation rates to manage the organization. In quick succession, the Partners appointed Gerald Bouey, the just-retired Governor of the Bank of Canada, as OTPP’s first Board Chair. Next, a representative, but highly-qualified Board of Directors was assembled. The Board hired Claude Lamoureux, a senior insurance industry executive, as OTPP’s first CEO, and he, in turn hired Bob Bertram, a senior corporate finance executive, as OTPP’s first CIO. January 1, 1990 marked the beginning of the new organization.
The new management team almost immediately swapped a large part of the returns on its 100% non-marketable bond portfolio for equity market returns. It began to build internal investment capabilities, especially in private markets. It initiated incentive compensation for its internal investment team. It privatized Canada’s largest publicly-traded real estate company Cadillac Fairview, which continues to be a wholly-owned OTPP subsidiary to this day. It initiated a formal balance sheet risk-budgeting protocol. It set unusually-high disclosure and reporting standards for itself. Through all this, it became an increasingly visible ‘active owner’ on a global scale, even to the point of acquiring Glass Lewis, the globe’s second-largest corporate governance/proxy advisory firm. Over the 1990-2016 period, OTTP has generated a net excess return of 2.2%/yr. versus an equal-risk reference portfolio, resulting in a cumulative $37 billion in incremental assets.i
OTPP’s unconventional structure and ‘active owner’ investment successes did not go unnoticed. They were copied in the creation and management of the Canada Pension Plan Investment Board (CPPIB), as well as by other major Canadian pension funds over the course of the ensuing 20 years. The Economist publication took note of these developments in a 2012 article titled “Maple Revolutionaries”. According to the article, these ‘Canada Model’ funds “have won the attention of both Wall Street, which consider them rivals, and institutional investors, which aspire to be like them”.
The Present
With the passage of another five years since the “Maple Revolutionaries” article, the time has come to begin to address an obvious question: does the ‘Canada Model’ actually produce better investment results? The best available data to answer the question is that collected by CEM Benchmarking Inc. on pension funds and other long-horizon investment organizations such as sovereign wealth funds.ii Specifically, CEM collects data on gross investment returns, the internal and external costs of running the investment operation, a passive reference portfolio which captures the organization’s investment policy, as well as organizational data such as fund size, proportion managed internally, and proportion invested in private market asset classes such as real estate, infrastructure, and private equity.
For those funds that choose to actively manage their assets, a key investment success metric is Net Value Added (NVA): gross return minus the cost of running the investment operation minus the return on the passively managed reference portfolio.
To study the ‘Canada Model’ performance question, I selected eight Canadian funds which:
- Have provided CEM with a complete annual data sets over the 2006-2015 period.
- Have had the three key ‘Canada Model’ features in place over the 10-yr. period (i.e., a clear mission, a strong independent governance function, and the ability to attract and retain the requisite talent to be successful).
- Have had sufficient scale to insource the investment function if they so chose.
Figures 1, 2, 3, and 4 plot the NVAs of the 8 ‘Canada Model’ funds and the NVAs of the other 132 funds for which CEM has continuous 2006-2015 data series against four metrics: 1. Average proportion of assets internally managed (% Internal), 2. Average proportion of assets in private market investments (% Privates), 3. Average investment costs (Cost), and 4. Volatility of NVA (SD NVA).
Figure 1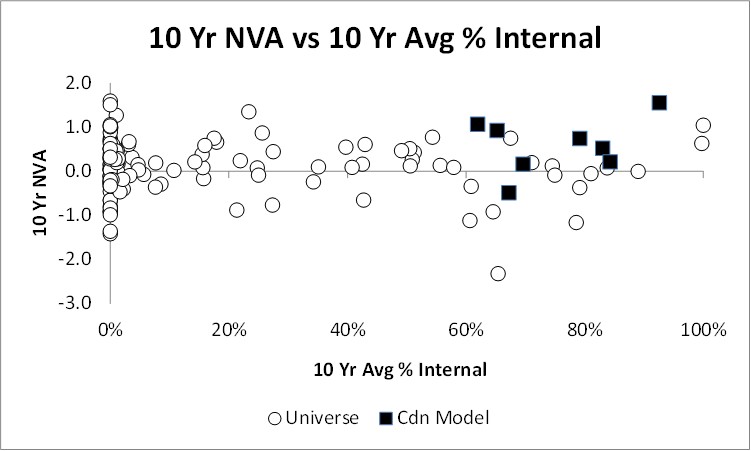
Figure 2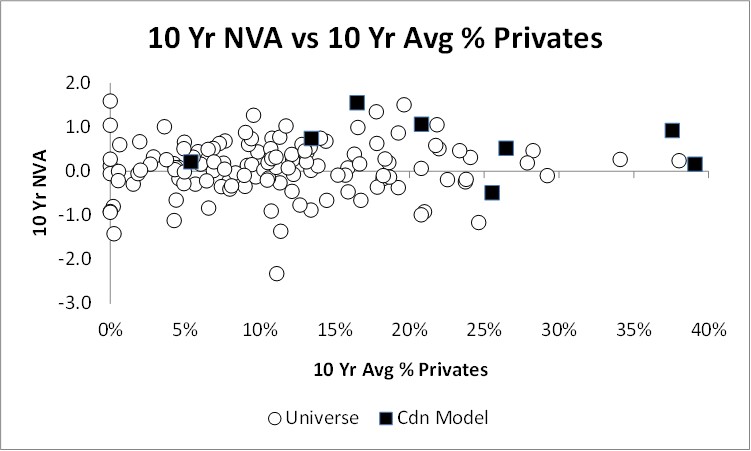
Figure 3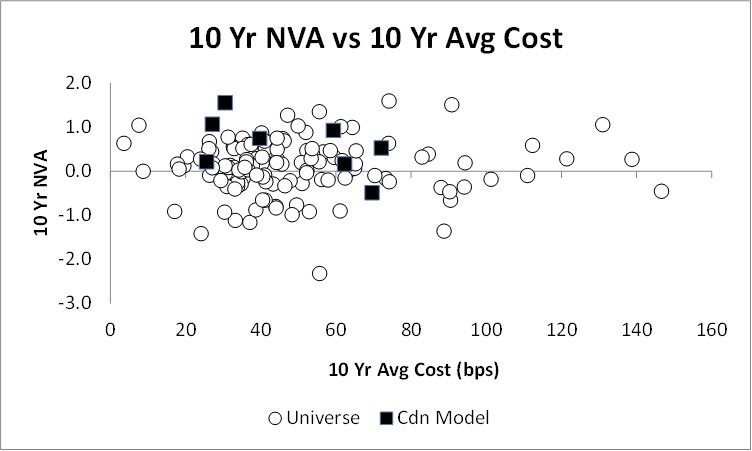
Figure 4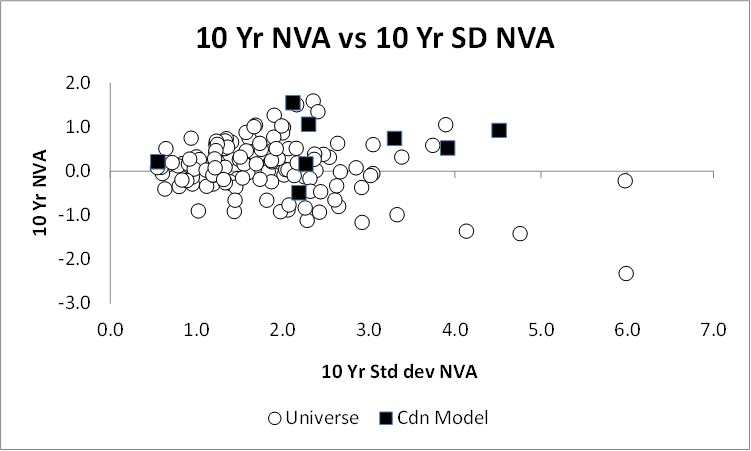 Source : CEM Benchmarking Inc.
Observations
The four Figures suggest:
- Figure 1 confirms that the 8 ‘Canada Model’ funds do indeed insource the investment function to a far greater degree than most of the other 132 funds in the 10-year CEM data base (average 75% vs. 17%).
- Similarly, Figure 2 confirms that the ‘Canada Model’ funds also have a greater tendency to invest in private markets (average 23% vs. 11%).
- Figure 3 indicates that despite the bias to allocate more money to private markets, the investment cost structures of the ‘Canada Model’ funds generally fall in the middle of the broader fund universe experience (i.e., the costs are neither very low nor very high). Average experience is 48bps vs. 50bps for the broader fund universe.
- Figure 4 indicates that the year-to-year actual return experience of the ‘Canada Model’ funds versus their reference portfolios is a bit more volatile than broader fund universe experience (average SD of NVA of 2.6% vs. 1.8%).
- All four Figures indicate that the ‘Canada Model’ funds were more successful at generating positive NVA over the 2006-2015 period than most of the 132 other funds. The success ratio of the former was 7/8 or 88%. The success ratio of the latter was 80/132 or 61%. The average NVA for the ‘Canada Model’ funds was 0.6%/yr. vs. 0.1%/yr. for the broader fund universe.iii
Based on these findings, how might we place a value on the ‘Canada Model’? A simple approximation would be to take the aggregate average value of the eight funds over the 10-year period ($832B), and apply the calculated excess annual return of 0.5% relative to the broader CEM fund universe (i.e., 0.6%-0.1%) to it. That amounts to $4.2B/yr., or $42B over a 10-yr. period…..which pays a lot of pensions!
The Future
I had a chance to sit down with the 96 year-old Peter Drucker in August 2005 and tell him that his 1976 “Unseen Revolution” book had not been totally ignored.iv It had provided the intellectual foundation for building a new kind of pension organization that by then, was beginning to show its mettle. Today, another 12 years later, evidence of the ‘Canada Model’s ability to generate sustainable pension wealth continues to build.
So what about the future? Where do we go from here? Can we build (or rebuild) more pension organizations with Drucker’s three success drivers? What would it take? It seems appropriate to let the master himself answer these questions with these famous ‘Druckerisms’:
- “Doing the right things is more important than doing things right.”
- “If you want something new, you have to stop doing something old.”
- “What gets measured, gets improved.”
The pensions world needs more Drucker!
Keith Ambachtsheer
Endnotes:
- From OTPP’s 2016 Annual Report.
- Full disclosure: I am a co-founder and Board Member of CEM and continue to be a share owner.
- With its positive 10 yr. average NVA of 0.1%, the broader CEM fund universe of 132 funds sets a highperformance bar for the ‘Canada Model’ funds. For example in Australia, calculations reported by Wilson Sy for the 1997-2016 period in a forthcoming paper suggest an average NVA for all its super funds of -1.3%/yr., with the industry, public service, and retail sectors producing average NVAs of -0.2%, -0.8%, and -2.0% respectively. The -2.0% NVA average for the Australian retail super funds closely matches the -2.2%/yr. for the actively-managed U.S. retail mutual fund sector estimated by Jack Bogle in a 2014 FAJ article. In Switzerland, a 2016 study by Ammann and Ehmann estimated an average -0.7% NVA for 139 Swiss pension funds over the 2010-2012 period.
- Drucker would die three months later.
KPA Advisory Services is pleased to share this edition of The Ambachtsheer Letter with all readers; if you wish to become a KPA Advisory Client/gain access to ALL Letters, please see the Services page on our website.
The information herein has been obtained from sources which we believe to be reliable, but do not guarantee its accuracy or completeness
Advisory Service clients have access to full issues of the Ambachtsheer Letter.
Become an Advisory Service Clientor Login