

May 6, 2024

September 1, 2018
Short-Term Vs. Long-Term Investment Risk: Really Understanding The Difference
“In the short run, the stock market is mostly driven by demand…..causing over- and under-reactions to underlying fundamentals. But in the long-run, the cash-flows that corporations supply are the ultimate drivers of stock returns.”
From “The Long-Run Drivers of Stock Returns: Total Payouts and the Real Economy”Philip Straehl and Roger IbbotsonFinancial Analysts Journal, Third Quarter, 2017
“Things have never been so good for humanity, nor so dire for the planet.”Arno KopeckyGlobe & Mail, 25 August 2018
The Quest for Understanding Continues
Recent Letters have addressed the challenges of actually being a long-term investor rather than just talking like one.i Part of that ‘being’ is to place investment risk in a long-term rather than short-term context. The February and April Letters began to address this challenge. There is, however, more to be said. Specifically, this Letter addresses two issues:
- How time-horizon impacts investment risk: post-WWII stock and bond returns show that lengthening holding periods from a short-term 3 years to a long-term 30 years materially alters the concept of investment risk and the respective roles stocks and bonds play as return generators and risk mitigators.
- Identifying ‘Known Unknowns’: foreshadowing prospective long-term investment risks not captured in the post-WWII-to-date investment period.
Before delving into these two issues, we first recap the key risk management messages of the February and April Letters.
Long-Term Insights from the Gordon Model
The Letters used the Gordon Model to show that over the long-term, prospective investment returns converge towards the sum of Y+G. That is, towards the sum of today’s investment income yield plus the growth rate of that investment income over the coming decades. Table 1 makes this point numerically with the S&P500 stock portfolio for the 70yr post-WWII period. For each of five thematically coherent sub-periods, the Table breaks down the realized real returns into the starting dividend yield Y, the real dividend growth rate over the period G, and the return component due to the change in the dividend capitalization rate over the period CAP. Note that CAP was a major positive return component in the 20-year Pax America II sub-period, and after that, a major negative return component in the 10-year Double Bubble Blues sub-period. However, also note that these positive and negative CAP swings have largely cancelled each other out over longer time spans.
Table 1 The Drivers of Real S&P500 Returns in Five Post-WWII Periods
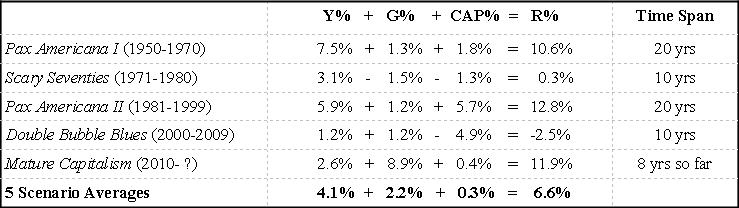
Table 1 shows that with Y always a known quantity, long-term investors should pay close attention to the G potential of the investments in their portfolio and monitor actual G performance versus expectations. It also shows that over the 70-year post-WWII investment period, G faltered temporarily only during the Scary Seventies decade, and that long-term investors should keep an eye out for positive CAP-related opportunities (e.g., a high Y in the early 1980s) and negative CAP-related risks (e.g., a low Y in the late 1990s). The April Letter noted that the current relatively low Y is offset by relatively low bond yields and relatively high G experience. This led to the conclusion that the current expected long-term S&P500 R is in a sustainable 3.5% to 4.5% range versus a current long-term TIPS yield of 1%.
Really Understanding the Difference between Short- and Long-Term Investment Risk
But what about the risk side of all this? How should this historical experience and these future expectations impact a fund’s asset mix policy today? That question cannot be answered without the context of a time-horizon. This continues to be murky territory for many funds, with the relationship between time-horizon and investment risk often still under-appreciated, misunderstood, and poorly addressed. To throw new light on it, this Letter relives the 70-year post-WWII period first as a short-term investor, and then again as a long-term investor. Logically, short-term investors correctly worry about CAP-related draw-down risk over short (e.g., 3yr) horizons, while long-term investors should mainly worry about much longer term G-related risks (e.g., 30yrs+).
To visualize the different investment risks these two types of investors faced during the 70yr post-WWII period, we calculated the 3yr and 30yr annualized real returns on the S&P500 at five-year intervals, starting in 1946. So the first 3yr period was 1946-1948, and the first 30yr period 1946-1975. The second 3yr period was 1951-1953, and the second 30yr period was 1951-1980…..and so on to the final 3yr period 2016-2018 and the final 30yr period 1986-2015. In total, this results in fifteen 3yr periods and nine 30yr periods. As a potential risk reducer, these same calculations were repeated for a Treasury Bond with a 10yr maturity. Finally, to appreciate opportunity and risk in dollar terms, all of the return calculations were converted into end-of-horizon dollar values based on a starting $1 investment.
The study produced these key findings:
- The fifteen annualized 3yr S&P500 real returns varied from a low of -11.6% to a high of 24.1%. In terms of an initial $1 invested, the 3yr terminal dollar outcomes ranged from $0.69 to $1.91.
- The fifteen annualized 3yr T-Bond real returns varied from a low of -6.8% to a high of 7.7%. In terms of an initial $1 invested, the 3yr terminal dollar outcomes ranged from $0.81 to $1.25.
- T-Bonds outperformed the S&P500 in six of the fifteen 3yr investment periods (i.e., 40% of the time).
- The nine annualized 30yr S&P500 real returns varied from a low of 4.4% to a high of 7.8%. In terms of an initial $1 invested, the 30yr terminal outcomes ranged from $3.64 to $9.26.
- The nine annualized 30yr T-Bond real returns varied from a low of -0.1% to a high of 4.1%. In terms of an initial $1 invested, the 30yr terminal outcomes ranged from $0.97 to $3.34.
- T-Bonds underperformed the S&P500 in all nine of the 30yr investment periods.
What should we make of these findings?
Study Implications
The strongest study implication is that over the course of the 70yr post-WWII period to date, bonds were an important risk mitigator for investors facing material drawdown risk over 3yr periods. They outperformed the S&P500 in six of the fifteen measurement periods, cushioning total fund returns when stocks did badly. So bonds were a valuable instrument for risk-adverse short-term investors even though they lowered the expected fund return (and hence the long-term wealth-creation potential) for these investors.
Bonds were not a risk mitigator when investment periods were stretched out to 30 years, as the S&P500 return exceeded the T-Bond return in all nine measurement periods. Long-term investors who used bonds as risk mitigation instruments in their funds received zero risk mitigation benefits. At the same time, T-Bond positions materially reduced the wealth-creation potential of their funds’ beneficiaries. For example, even in the lowest-return 30yr period, $1 invested in the S&P500 was worth $3.64 30 years later. This compares to a T-Bond outcome range of $0.97 to $3.34.
What about the defense that long-term investors could not have known this ‘zero risk mitigation’ outcome before the fact? In my view, fund beneficiaries whose wealth was negatively impacted by the cautious risk mitigation policies of their fund managers in the 70yr post-WWII period should not let them off the hook too easily. The Gordon Model has been around since the 1950s, and it was based on John Burr Williams valuation model work published in the 1930s.ii G would have had to be materially negative for decades for stocks not to outperform bonds over 30yr periods after WWII. Surely a highly improbable proposition.
More likely, fund managers with investment mandates involving zero short-term drawdown risk knew this to be the case, but did not think their clients would tolerate the predictable poor short-term performance periods for a 100% stocks investment policy along the way. This reality creates a serious dilemma for these fund managers. Do they hold bonds to cushion short-term stock market retreats at the expense of long-term beneficiary wealth maximization? Or do they invest to maximize their beneficiaries’ long-term financial interests and take the heat for underperforming during short-term stock market retreats?iii
The Next 30 Years
The knowledge that stocks outperformed bonds in all nine measured 30yr investment periods starting in 1946 does not take long-term fund managers off the hook for thinking through the next 30 years. Is there a scenario that would see stocks between now and 2050 earn a lower R than the 1% real return on offer through T-Bonds today? Or in Gordon Model terms, is there a plausible scenario today that could lead to a negative G/negative CAP combination resulting in a 30yr R under 1%?
In his recent essay “The Race of our Lives Revisited”, Jeremy Grantham provides a possible answer: “It was always going to be difficult for us Homo Sapiens to deal with the long-term, slow-burning problems that threaten us today: climate change, population growth, increasing environmental toxicity, and the impact of all those three on the future ability to feed the 10 billion people projected for 2050.” In making this case, he and a growing group of like-minded experts note:
- The linear environmental projections made in the 1980s and 1990s for rising carbon and methane emissions, loss of sea ice, rising sea levels, deteriorating marine eco-systems, falling bio-diversity, increasing droughts and floods, falling soil productivity, and rising environmental toxicity have all underestimated current realities. The related metrics are all accelerating in the wrong direction.
- While the resulting prospective destruction of property and the deterioration of air and water quality (and quantity) are serious problems in their own right, the greatest threat will come from falling crop yields in the face of growing food demand. With its weak governance structures, Africa will be hardest hit, triggering accelerated political turmoil there and even higher rates of migration to Europe.
- Meanwhile, mainstream economic and accounting systems continue to largely ignore this steady ongoing destruction of natural capital.
- Our continued political, financial, and emotional focus on short-termism and growth makes Home Sapiens ill-equipped to seriously deal with the long list of now-accelerating threats facing planet Earth. The price of seriously dealing with these threats is still deemed to be too high in too many places.
- Not all the news is bad. The Technology super-cycle is far from over. Capital costs continue to be low. Emerging markets demographics support continued economic growth. Green energy generation and storage technologies continue to improve as costs continue to fall. Green capital is readily available. Accounting systems are beginning to capture natural capital costs previously ignored. Carbon emissions are being reduced, captured, and extracted. Adaptation strategies to future negative environmental impacts are being planned and implemented. However, it is impossible to know the degree to which the combined impact of these efforts will address “the long-term, slow-burning problems that threaten us today”.
So what to do?
Investment Implications
If the next 30 years do indeed hold the prospect of a material degree of environment-related property destruction, deterioration of air and water quality, rising toxicity, falling soil productivity, and wide-spread food shortages, what are its investment implications? In a broad, strategic sense, the answer is obvious: invest in solutions/adaptations to these problems, and avoid exposure to its root causes and destructive impact consequences. To help investors think this through, PRI has published its “Impact Investing Market Map” which organizes “solutions/adaptations to these problems” into 10 coherent investment themes.iv The new publication by Newsweek VANTAGE “Going Mainstream: The Future of ESG Investing” provides further investment policy context for the next 30 years.v
In short, long term investors have a fiduciary obligation to understand the long-term risks and opportunities facing their beneficiaries and to address them through constructive, forward-looking actions. Side-stepping this obligation by simply buying low-Y bonds will not do.
Keith Ambachtsheer
Endnotes:
- For example, see last year’s May, July, and September Letters, as well as this year’s January, February, April and July Letters.
- For example, see John Burr Williams’ 1938 book “The Theory of Investment Value”, and Myron Gordon’s 1959 article “Dividends, Earnings, and Stock Prices”.
- Regulation can also be a problem. For example, pension regulations require Dutch pension funds to consider short-term market volatility in setting their investment policy.
- The 10 themes are Energy Efficiency, Green Buildings, Renewable Energy, Sustainable Agriculture, Sustainable Forestry, Water, Affordable Housing, Education, Health, and Inclusive Finance. Access the full report at https://www.unpri.org/thematic-and-impact-investing/impact-investing-market-map/3537.article
- This 65-page document authored by Harry Hummels, Rob Bauer, and Joyce Mertens points to four emerging trends: 1. Greater ESG integration, 2. Greater investor engagement, 3. Greater transparency in reporting, and 4. Greater divestment in sectors such as nuclear weapons, tobacco, and coal.
KPA Advisory Services is pleased to share this edition of The Ambachtsheer Letter with all readers; if you wish to become a KPA Advisory Client/gain access to ALL Letters, please see the Services page on our website.
The information herein has been obtained from sources which we believe to be reliable, but do not guarantee its accuracy or completeness.
Advisory Service clients have access to full issues of the Ambachtsheer Letter.
Become an Advisory Service Clientor Login