

October 26, 2023

January 8, 2024
Improving Investment Models For Pension Funds: How Are We Doing?
“The Adaptive Markets Hypothesis (AMH) looks at financial markets as a dynamic ecosystem. This allows us to understand the relation between investment performance and the interactions of various types of investors. You may not be able to time the markets day by day, but you can certainly see trends over longer holding periods.”
Andrew Lo (2004)
“Knight and Keynes lost the battle to put radical uncertainty at the heart of economic analysis….so instead, organizations are run with reliance on models which claim knowledge of the future that we do not have.”
John Kay and Mervyn King (2020)
“Traditional investment paradigms fall short in the current era of interconnected challenges, which include rapid technological shifts, geopolitical changes, and environmental pressures. Our goal is to contribute to the development of a resilient investment framework that enables investors to navigate current challenges and anticipate future uncertainties.”
Herman Bril and Willem Schramade (2023)
When Modern Portfolio Theory Was Modern
Modern Portfolio Theory (MPT) and I both entered the investment world some 50 years ago. Fate would have it that my first job in that investment world (1969) was to understand MPT, and to assess its practical relevance to institutional investment departments. A decade later (1979) the Financial Analysts Journal published my conclusions (with Jim Farrell) in an article titled “Can Active Management Add Value?”. The short answer was ‘yes’, but only under a series of conditions that were very difficult to replicate in ‘real world’ institutional investment departments.
The basic problem was low correlations between the return predictions of investment professionals and actual subsequent outcomes. Why was that? The Efficient Markets Hypothesis (EMH) provided the answer: competitive financial markets where all knowable information is continuously embedded in securities prices. Further, with investors generally being risk-averse, market efficiency ensures that higher-risk investments are generally priced to provide a risk premium over lower-risk investments. While that expected risk premium is often realized, perceived riskiness sometimes becomes reality, leading to material investment losses.
Even today this 50 year-old MPT/EMH structure continues to shape investment beliefs and practices. A good example is the rise of low-cost, passive, index-based investing. Why pay active management fees that are greater than the expected value that active management is likely to produce? Instead, simply establish your risk budget, and let financial markets determine the commensurate reward you will earn.
Enter the Adaptive Markets Hypothesis
It was only a matter of time before an investment model surfaced that recognized humans are not the rational utility-maximizing robots assumed in the MPT/EMH model. That honor goes to MIT Sloan School of Management’s Prof. Andrew Lo. He began to lay out the basis for his Adaptive Markets Hypothesis (AMH) some 20 years ago, and has been refining it ever since. More recently. Profs. John Kay (Oxford) and Mervyn King (Cambridge) also made an important contribution to the ‘rethinking the investment model’ discussion by distinguishing between quantifiable financial risk and unquantifiable financial uncertainty. Again, the challenge is to find a reasonable middle-ground in this risk/uncertainty spectrum.
How to turn these insights into a workable investment model at the asset allocation level? Long-time readers of this Letter know our answer has been to identify and articulate multi-decade investment themes that provide a frame of reference within which to lay out reasonable investment return prospects along the risk spectrum. Table 1 below shows the most recent version of the model, focusing on the post-WWII real return behavior of the S&P500 stock portfolio and the simultaneous rise and fall of long Treasury Bond yields (TY). It posits that we have lived through five investment environments, entering the sixth, Interconnected Instability, in 2020.
Using the simple Gordon Model, S&P500 real returns are decomposed into its starting dividend yield (DY%), real dividend growth over the investment period (G%), and the change in the dividend capitalization rate over the period (CAP%).
Table 1 The Drivers of Real S&P500 Returns in Five Post-WWII Periods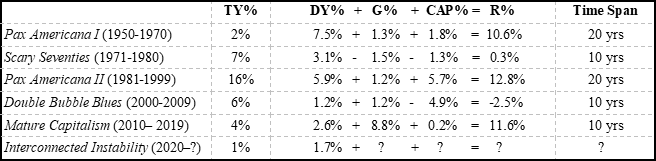 Table 1 provides important insights into where we have been, where we are, and where we may be going:
- The S&P500 dividend yield was 7.5% in 1950 vs. a 2% long Treasury bond yield. Clearly, investors were still very risk-averse in the early post WWII days. However, the world did not end, and equity investors were well-rewarded over the 1950-1970 Pax Americana I period with a 10.6%/yr. real return.
- Consumer prices and bond yields began to rise as the 1970s decade approached, leading to the Scary Seventies with its oil shocks and cost-push inflation, leading eventually to sky-high double digit interest rates. The S&P500 dividend yield rose too… to 5.9% by 1980. The result was a minimal 0.3%/yr. real return over the 1971-1980 period for the S&P500.
- But once again, the world did not end. Instead, the 2-decade Pax Americana II period of falling inflation and interest rates, Russia’s glasnost, modest but steady economic growth, and rising stock prices followed, resulting in a 12.8%/yr. S&P500 real return.
- However, with the approach of millennium year 2000, unwarranted optimism about the future of equity investing in the form of the ‘dot-com bubble’ had taken hold. As a result, the S&P500 divided yield had fallen to 1.2% vs. a much higher long Treasury yield of 6%. Inevitably, the ‘dot-com bubble burst, followed by the subprime mortgage-driven Global Financial Crisis, making the first decade of the 21st Century a Double Bubble Blues event with a negative real S&P500 return of -2.5%/yr.
- Collective action by the globe’s central bankers saved the day, setting the stage for the Mature Capitalism decade of falling inflation and interest rates, strong corporate earnings and dividend growth due to the rise of the Magnificent Seveni, and due to global economic integration materially reducing global labour costs. All this led to an outsized real S&P500 return of 11.6%/yr. over the decade.
- However, as the decade ended, Covid struck, global supply chains buckled, geo-political conflicts made headlines, as did the growing destructive impacts of climate change. All this against a backdrop of aging demographics across North America, China, Japan, and Europe. These visible socio-environmental-economic shocks led us to declare a transition of eras from Mature Capitalism to Interconnected Instability in 2020.ii Since then, long Treasury yields have risen from 1% to 4%. So far, the S&P500 dividend yield has not risen in concert. In fact, it has declined marginally from 1.7% to 1.6% while dividends have continued to grow.
In conclusion, Table 1 demonstrates Andrew Lo’s Adaptive Markets Hypothesis in action. Financial markets are not a ‘random walk’ over longer-term holding periods. Instead, they mirror a ‘dynamic ecosystem’ that reflects the direction of global socio-environmental-economic forces over time.
Where To From Here?
While the AMH helps explain where financial markets have been, the Kay-King distinction between risk and uncertainty explains why it cannot precisely predict where financial market will go. Nevertheless, Table 1 offers useful insights:
- Real S&P500 returns have averaged 6.6%/yr. across five post-WWII ‘eras’, within an ‘era’ range of -2.5%/yr. and 12.8%/yr.
- The three average real S&P500 return components were: Starting DY%=4.1%, G%=2.8%, CAP%=0.3%.
- The S&P500 DY% today is 1.6%, about the same as the current 1.7% real yield on long Treasury bonds. Assuming little positive S&P500 CAP% potential at the current low DY% of 1.6%, the only material source of a prospective equity risk premium in today’s Interconnected Instability world is G%. Is a long-term 4%/yr. real G% projection for the S&P500 reasonable in a world where the post WWII average was 2.8%? The fact that 4% is less than half the 8.8% growth rate actually achieved in the Mature Capitalism era suggests it may indeed be a plausible assumption, leading to a plausible S&P500 real return projection today of R%=1.6%+4.0%+0%=5.6%. If real G% experience is materially lower than 4%/yr. over the Interconnected Instability era, average equity market returns will be disappointing into the 2030s.
This piece of mental modelling raises another important question. The S&P500 index includes 493 companies other than the Magnificent Seven. These 500 exchange-listed companies in turn are a subset of a global universe of some 15,000 listed companies, and beyond them there are many thousands more private ones. What is the best way for institutional investors to go from macro asset allocation to micro security selection?
From Macro Modeling to Micro Modeling
Key carry-overs from macro asset allocation models to micro security selection models are the Y% and G% components. More specifically, what is a company paying out in dividends (or share buy-backs) today, and what are the prospects for growing that capability in the future? Here are three promising micro frameworks to help address these questions. The first two were described in earlier Letters, the third comes from a new paper cited on page 1 of this Letter:
- Understanding Corporate Life-Cycles: Madden proposes that like humans, corporations have lifecycles. Its four stages are: 1. Early Growth/High Innovation, 2. High Performance/Competitive Fade, 3. Mature/Cash Cow, 4. Failing Business Model. Successful value-creating firms generate returns above their cost of capital by surviving Stage 1 and avoiding Stage 4.iii
- Understanding Corporate Pathways to Net-Zero: Montgomery and Van Clieaf propose there are four paths for corporations to achieve net-zero emissions status: 1. Eco-Efficiency in current business model, 2. Business Model Transformation, 3. New Eco-Startups, 4. Eco-System Transformers. It is essential for corporate boards to insist their corporation chooses one of these four pathways and develops a clear implementation plan.iv
- Understanding and Building Corporate Resilience: Bril and Schramade propose that in a VUCA (volatile, uncertain, complex, ambiguous) world, corporate boards should insist that their corporation tests its resilience to adverse conditions it may encounter in the years ahead. The key questions are (a) what might those adverse conditions look like, and (b) what is our ability to recover if we encounter them?v
These three insights suggest that to be effective, modern micro security selection models require institutional investors have access to large high-quality databases and advanced AI-driven data processing capabilities. But even that will not be enough. They must also have the capability to engage the boards and C-suites of the companies they invest in. Are corporate investment targets really implementing the insights provided by the three models? If not, what are the actions investors should take?
To conclude this Letter, I asked Google what a ‘model’ was. Answer: “a ‘model’ is a simplified description, possibly a mathematical one, of a system or process to assist in calculations, predictions, and making decisions.” We need good models to make good decisions in the complex world of pension design, governance, and investing…..and we need to keep improving them. This Letter shows we are making progress, but also that there is more work to do.
Keith Ambachtsheer
Endnotes:
- The Magnificent Seven are Microsoft, Amazon, Meta, Apple, Alphabet, Nvidia, Tesla.
- See the October 2022 Ambachtsheer Letter for more.
- See the October 2021 Ambachtsheer Letter for more.
- See the May 2023 Ambachtsheer Letter for more.
- Bril and Schamade (2023) “Strengthening Investment Portfolios Through Resilience – A Primer” SSRN.
KPA Advisory Services is pleased to share this edition of The Ambachtsheer Letter with all readers; if you wish to become a KPA Advisory Client/gain access to ALL Letters, please see the Services page on our website.
The information herein has been obtained from sources which we believe to be reliable, but do not guarantee its accuracy or completeness.
Advisory Service clients have access to full issues of the Ambachtsheer Letter.
Become an Advisory Service Clientor Login