

May 6, 2024

March 1, 2019
Rethinking Asset Owner Performance Measurement: Insights From The Integrated Reporting Framework
“What gets measured gets managed”
Attributed to Peter Drucker
Rethinking Performance Measurement
This Letter continues to make the case that the broad adoption by asset owners of the <IR> Framework would foster clearer, more concise narratives about the value these organizations (e.g., pension funds, sovereign wealth funds, endowment funds) create for their own stakeholders and for society at large. The January Letter described the <IR> Framework and adapted it to an asset owner context. The February Letter dug more deeply into defining ‘value-creation’ in that asset owner context, and into the requisite business model features required to successfully produce it. This third Letter follows from the logic of Peter Drucker’s observation that ‘what gets measured gets managed’. Specifically, this Letter addresses two questions: 1. What does the <IR> Framework tell asset owners they should measure? and 2. What metrics do they need to meet this obligation?
What Should Asset Owners Measure?
Following the logic of the January and February Letters, let’s start with a list of value-creation activities that are candidates for measurement. The Letters made a clear distinction between micro and macro asset owner value-creation:
- Four Micro Value-Creating Activities: 1. Explaining organizational purpose and mandate to stakeholders and how intergenerational fairness is enforced, 2. Making and explaining promised payments and placing them in context for members, 3. Creating and enforcing an investment risk management framework and protocol that reflects stakeholders’ ability and willingness to bear investment risk, 4. Generating risk-adjusted long-term net investment returns in line with expectations.
- Two Macro Value-Creating Activities: 1. Setting out the principles of sustainable investing and how the organization is adhering to these principles. 2. Setting out the UN’s Sustainable Development Goals, and how the organization is contributing to their achievement.
Saying is one thing, doing another. What metrics do asset owner organizations need to meet these <IR> Framework reporting obligations?
Reporting on Micro Value-Creating Activities 1 and 2
Reporting on Micro Value-Creating Activities 1 and 2 is largely a narrative challenge. Its specifics will vary depending on the asset organization purpose and mandate. It will differ between pension, sovereign, and endowment funds. There will even be considerable diversity within each of these three broad categories.
For example, retirement income generation arrangements can range all the way from fully-guaranteed DB plans, to various forms of Target Benefit (TB) Plans, to simple pooled retirement savings arrangements.i Having said that, many asset owner organizations provide a suite of financial services to their beneficiaries/clients. Depending on the asset owner type, these services could include benefit administration, record keeping and reporting, insurance, financial advice, call center access, etc. This creates two ‘value-for-money’ questions for many asset owner organizations. Compared to its peers: 1. How good is its suite of services? and 2. At what cost is it providing them?
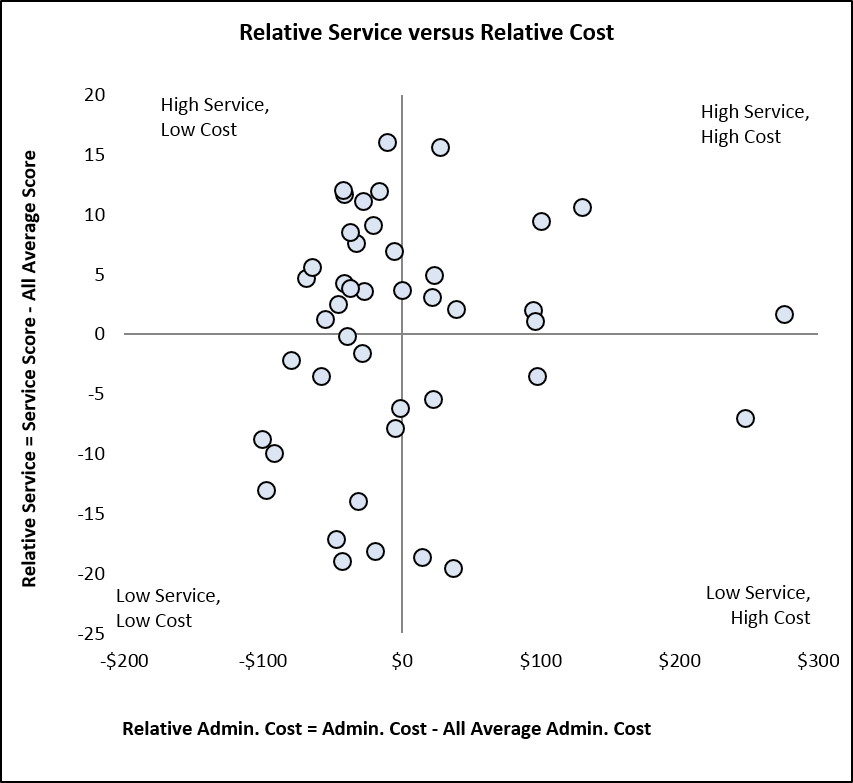
To answer these questions, CEM Benchmarking Inc. creates a quality metric for participating organizations’ member services offerings and calculates the cost of service delivery.ii Figure 1 plots the 2018 Relative Service Score vs. Relative Service Cost/Member combinations for an international sample of 46 participating organizations.iii Note the wide experience range in both service quality and service cost, with 17 of the 46 organizations performing in the relatively high service/low cost quadrant. They are clearly delivering value for money relative to the other 29 organizations.
Figure 1 Service Quality versus Service Cost/Member
 Source: CEM Benchmarking
Reporting on Risk Management Performance
Number 3 on the list of Micro Value-Creating Activities was “creating and enforcing an investment risk management framework and protocol that reflects stakeholders’ ability and willingness to bear investment risk”. A relevant metric here is fund return volatility: low risk tolerance should translate into low fund return volatility experience and vice versa.iv Another metric here is ‘excess return’ relative to the return on a relevant risk-free strategy: in a risk-averse world, risk-taking requires an expectation of compensation. Historically, realized long-term risk premiums have been in the 3%-5% range. All this leads to two other performance measurement questions: 1. ‘Relative to our expectations, what net risk premium is our fund generating at what level of return volatility?’ and 2. How does our performance compare to our peers’?’
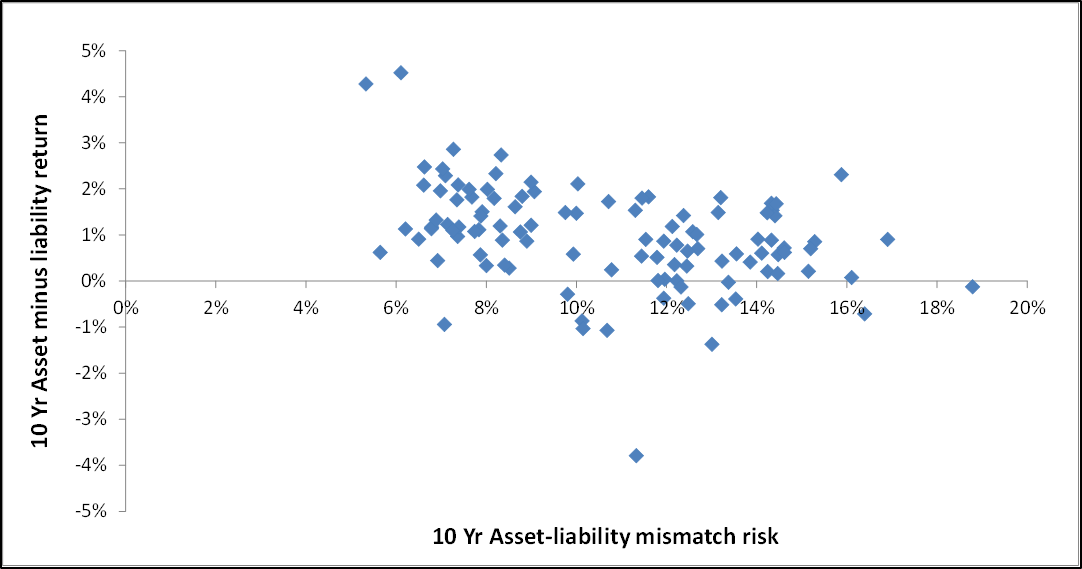
To answer these questions, CEM collects fund return and cost data from participating asset owner organizations, as well as data on a customized risk-free ‘liability’ portfolio with a duration and inflation-sensitivity that reflects the asset owner’s payment obligations. Figure 2 plots a fund’s excess return versus its return volatility for an international sample of 108 participating asset owner organizations for the 10-year period from 2008 to 2017. As in Figure 1, Figure 2 displays a wide range of experience. Annual volatility versus the relevant risk-free portfolio ranged from under 6% to over 18%. Annualized net risk premiums ranged from over 4% to under -3%. Some of the highest asset owner risk premiums earned over the 2008-2017 period were achieved with the relatively lowest return volatility experience, indicating material risk management-related value-creation for those organizations.
Figure 2 Investment Risk Premiums Earned vs. Investment Risk Undertaken
 Source: CEM Benchmarking
Reporting on Active Management Results
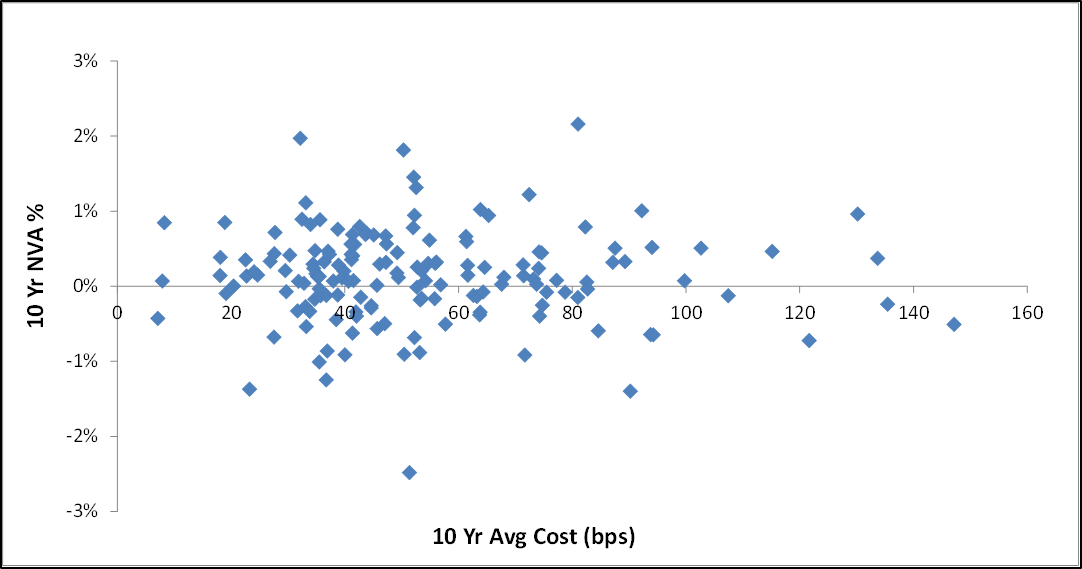
Number 4 on the list of Micro Value-Creating Activities was “generating risk-adjusted long-term net fund returns in line with expectations”. A key metric here is the actual long-term fund return net of investment expenses versus the return on an alternative low-cost passive strategy with an asset mix that reflects the risk tolerance of asset owner’s stakeholders. Using CEM’s terminology, this is a fund’s Net Value-Added (NVA). Figure 3 below plots the 10-year NVAs for an international sample of 156 funds versus their average 10-year investment expenses for the 2008 to 2017 period. Once again, note the wide range of experience, with 10yr NVAs ranging from +2% to -2% and average annual investment expenses from 5 basis points to 150 basis points (bps). Note that the highest NVA funds had expenses in the 35-80bps range….but so did funds with some of the most disappointing NVAs.
Measuring ‘Sustainability’ Performance
Figures 1, 2, and 3 provide essential asset owner value-creating performance information at the micro level. While essential, it is increasingly not sufficient. The demand for sustainability-related disclosures is on the rise. Also, the kind of systems thinking fostered by the Principles for Responsible Investing and the <IR> Framework leads to a requirement to think not only at the ‘micro’ organizational level, but at the ‘macro’ global economy level as well.
Figure 3 Net Value-Added Investment Performance vs. Investment Expenses
 Source: CEM Benchmarking
What might some of these new micro and macro ‘sustainability’ metrics look like? Here is a starting list of 7 candidates (more detail to come in future Letters):
- Micro Sustainability Metrics: 1. resource allocation to long-term socio-climate-economic scenario-building capabilities and to building sustainable cash-flow and valuation prediction models, 2. actual predictive power of the cash-flow and valuation prediction models, 3. resource allocation to, and results from corporate stewardship/engagement actions, 4. resource allocation to, and results from private markets sourcing and management capabilities, 5. overall organizational culture quality and incentive structures.
- Macro Sustainability Metrics: 6. resource allocation to fostering national and international acceptance of and adherence to the principles and practices of sustainable investing, 7. impact reporting of how investment activities support the UN’s 17 Sustainable Development Goals.
Don't put off until tomorrow what you can do today. Start measuring and reporting on your macro value-creating activities now!
Keith Ambachtsheer
Endnotes:
- For example, see last year’s October Letter and December Letter for more on these considerations.
- Full disclosure: I am a co-founder of CEM and continue to be a Board member and shareholder.
- The potential Service Score range was 0-100. The average score for the 46 organizations was 79, with a range from 60 to 96. The average Service Cost/member was $116, with a range of $15 to $450.
- Last year’s September Letter explains that investment time horizon is another key element in the risk tolerance puzzle. For example, not being subject to return-sequencing risk should materially increase tolerance to short-term return volatility.
KPA Advisory Services is pleased to share this edition of The Ambachtsheer Letter with all readers; if you wish to become a KPA Advisory Client/gain access to ALL Letters, please see the Services page on our website.
The information herein has been obtained from sources which we believe to be reliable, but do not guarantee its accuracy or completeness.
Advisory Service clients have access to full issues of the Ambachtsheer Letter.
Become an Advisory Service Clientor Login